Anthropometry Lessons Learned Part I: Mythical Average, 5th and 95th Percentile People
All of us need some representations of individuals around which to design and build our products. Unfortunately, many people have been using what they believe to be average, 5th and 95th percentile people. In this article we will show:
• The average “person” doesn’t exist
• A model with all average dimensions isn’t shaped like a real person
• People with 5th and 95th percentile values for more than 4 measurements are highly unlikely
• 5th and 95th percentile people are impossible to construct
If ever you have used these methods, they didn’t work and if you were wondering why read on…..
Mythical Average People
In 1952 Gilbert Daniels tried to find one man out of 4,063 men who was average for everyone of 131 measurements. He defined the average as middle 30% for each variable. After just 10 variables there was no one left, who was average for all 10. Everyone was smaller or larger than average for something. An illustration of this phenomenon is shown in figure 1. It shows the percentile values for 3 subjects, for 10 measurements. Every subject is in the middle for some measurements and either larger or smaller than the middle for others. Subject 89 is both below and above the middle for some measurements.
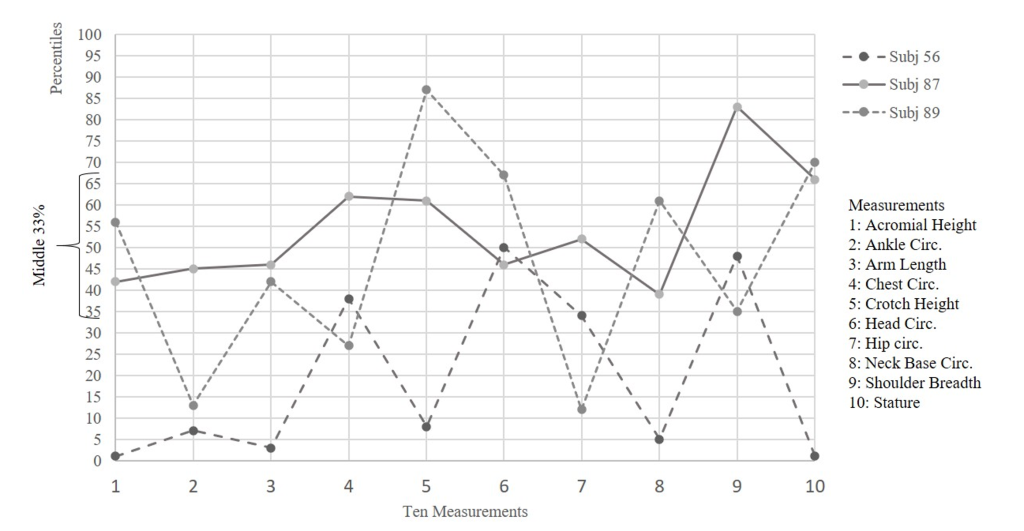
Figure 1. Proportions for three random subjects (from Robinette et al 2025)
While Mr. Daniels demonstrated that there is no average man, some people still believed that designing for averages was a good idea. However, even this proves to be incorrect. In 2004, the HFES 300 Committee illustrated that if an average model is constructed, it has a different shape than any of the subjects in the sample. This is illustrated in figure 2. It shows 3 “subjects” with small, medium, and large proportions and we show their average. The average shape is different and too small for all three. Therefore, if we use a statistical average construct we may not fit anyone.
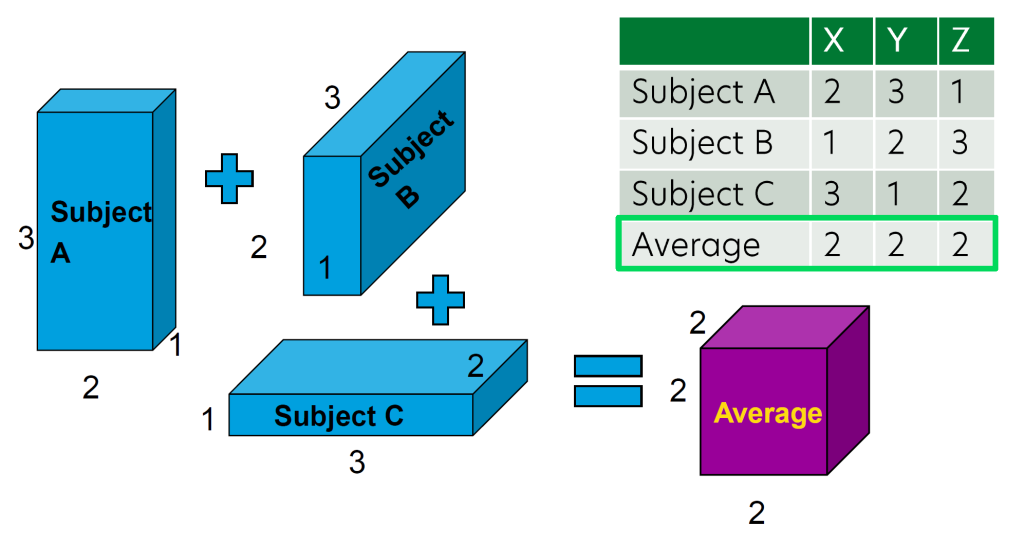
Figure 2. Average may not fit anyone.
This means a product designed for the average, 2x2x2, will be both too small and at the same time too large for each individual, 3x2x1, as shown in figure 2. The new product may not fit anyone. Some people might find this surprising because some schools still teach this method, but the unintended consequence of design using an average shape and then not fitting customers has been well known now for more than 70 years. When designing using the average didn’t work, design teams tried the percentile approach.
5th to 95th Percentile Myths
Now some people believe that the answer is to design around the 5th and 95th percentiles, with the belief that this will accommodate 90% of the population. This is also not true. In fact, it is worse because the 5th and 95th percentiles do not add up.
Figure 3 is taken from the SAE technical paper by Robinette and McConville (1982) and illustrates that when 5th or 95th percentiles are calculated for segments of a measurement (in this case stature), they do not add up to the 5th or 9th percentile of the measurement. In this example, 7 segments were calculated for each person in a sample of 3,235 women by subtraction such that the sum of the 7 segments was equal to the Stature. Then the 95th percentiles were taken for each of the measurements and added together the sum was 188.81 cm. However, the 95th percentile Stature was only 173.06 cm. The sum of the 95th percentiles of the parts was 15.75 cm larger than the 95th percentile of the sum. To re-state this, while Stature was always equal to the sum of the 7 segments in the sample, the sum of the 95th percentiles for the 7 segments was larger than the 95th percentile Stature. This results because the person who is 95th percentile in size for one measurement is not the same person who is 95th percentile for another. So, when we combine percentiles we are combining body parts from different people.
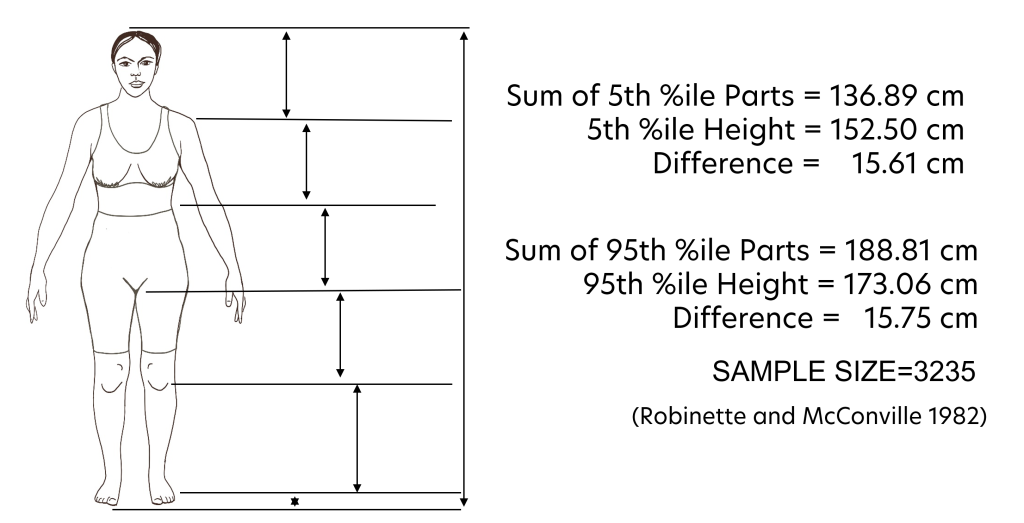
Figure 3. Sum of percentiles of the parts does not equal the percentile of the sum.
The other issue with 5th or 95th percentile values is the probability of being 5th or 95th for more than one measurement of dimension can be so small as to be impossible. For example, the probability of a person being 95th percentile or greater when the measurements are not correlated is shown in table 1.
| Number of measurements | Probability of being greater than 95th Percentile | Number of people out of 100,000 |
| Only 1 | 0.05 | 5,000 |
| Both of 2 | 0.0025 | 250 |
| All of 3 | 0.000125 | 12.5 |
| All of 4 | 0.00000625 | 0.625 |
Table 1 Probability of being greater than 95th percentile for uncorrelated variables.
The probability of being larger than the 95th percentile for every one of 4 variables is less than one person out of 100,000. How many until we can agree that it is impossible?
If using averages and percentiles doesn’t work for design. What does?
The Case for Cases
The best representations to use are individual people rather than statistical constructs. We call these individuals “cases”. A case can have three forms: 1) a list of measurements of an individual, 2) a 3-D or 4-D model of an individual, or 3) the actual individual. The actual individual is sometimes called a fit model or a live model. When we use an actual person, we know we will fit at least one person and probably lots of people who are like that person. If we choose well, we can maximize the number of people we accommodate in the fewest number of sizes.
More information on how to select good cases can be found in Chapter 3 of Robinette, K.M., Veitch, D., Alemany, S., & Bredenkamp, K. (2025). Product Fit and Sizing: Sustainable Product Evaluation, Engineering, and Design (1st ed.). CRC Press. This chapter can be downloaded for free here:https://doi.org/10.1201/9781003397533
However, if you would like someone to help, reach out to Anthrotech which provides this type of consulting service.
References
Dainoff, M., Gordon, C., Robinette, K.M., & Strauss, M. (2003). Guidelines for using anthropometric data in product design, HFES Best Practices Series 2003, Human Factors and Ergonomics Society.
Daniels, G. S. (1952). The average man? AIR FORCE AEROSPACE MEDICAL RESEARCH LAB WRIGHT-PATTERSON AFB OH. https://apps.dtic.mil/sti/tr/pdf/AD0010203.pdf
Robinette, K. M., Veitch, D., Alemany, S., and Bredenkamp, K. (2025) Product Fit and Sizing: Sustainable Product Evaluation, Engineering, and Design, CRC Press, ISBN 9781032491189
Robinette, K.M. and McConville, J.T. (1982). An Alternative to Percentile Models. SAE Technical Paper 810217, in 1981 SAE Transactions, pp. 938-946, Society of Automotive Engineers, Warrendale PA.
Anthropometry Lessons Learned Part II: Challenges Particular to Designing Head and Face Wearables
Anthrotech Connections Newsletter – May 2025
Anthrotech is at the forefront of the ever-changing field of anthropometry.
"*" indicates required fields